

A low-latency model demo is straightforward: put a client near one warm GPU in one data center, send a predictable request, and measure the response. Production-grade inference is a different system. Every request must pass authentication, quota and billing checks, reach a healthy replica somewhere in a global GPU fleet, survive node and region failures, and still land inside the same tail-latency target.
For latency-sensitive production workloads, that target is often a p99 in the sub-600ms range end-to-end, with an operational p95 target of roughly 300 to 400ms.
This article covers how we’re working backward from that budget, to design our platform for reliable real-time inference. This article covers how we found the worst-case delays outside the model, and redesigned the request path without giving up Kubernetes, global capacity, or fault tolerance.
This architecture is rolling out across the Parasail platform to improve p95 and p99 time-to-first token (TTFT) for every workload in this latency-sensitive class.
A fast model is easy. Real-time inference in production is not.
Across the platform, we see this pattern in products that rely on an LLM call inside a real-time production path:
- Voice agents that need to respond at conversational speed and make conditional decisions in real time.
- Fraud-screening systems that need to flag a transaction before it completes.
- Support agents pulling context and calling tools mid-conversation.
- Recommendation engines re-ranking results as a user scrolls.
For these products, the majority of responses must arrive quickly enough to support a reliable product experience, even when traffic shifts or infrastructure fails. A fast median is not enough if one request in a hundred arrives too late to be useful.
Beyond the model: Our approach to optimization
The first version of the problem looked deceptively familiar: optimize inference with a faster model. The production request path showed why that framing was incomplete.
Before a token could be generated, a request had to cross an API gateway for API-key validation, quota enforcement, billing and routing. It then had to make a second hop from that gateway to a healthy GPU replica. Those replicas were distributed across regions and providers, joined through a hybrid K3s/Rancher environment, and connected through a WireGuard-backed CNI and private overlay.
That architecture was necessary for production before the model got involved. It also meant the latency target had to cover four concerns at once:
- Tail latency: p95 and p99 capture the unlucky routes, queues and retries hidden by a healthy median.
- Global networking: physical distance is unavoidable, but extra public-Internet and ingress hops are not.
- Model serving: scheduling, queueing, prefill, decode, batching and GPU utilization all spend from the same budget.
- Reliability: load balancing, autoscaling and failover must preserve the fast path rather than create a separate slow path.
The engineering question therefore changed from how fast is the model? to how do we keep the entire distributed system under 600ms for 99% of requests?
Tail latency: Why p95 and p99 are the real product metric
Median latency can stay flat while the product experience degrades. The median describes the typical request; it says almost nothing about requests that take a longer network route, encounter connection setup, cross an overloaded gateway, wait behind a batch, or fail over to a cold replica.
Global traffic makes that gap worse. A routing decision that adds only occasional delay may barely move p50, yet dominate p95 and p99. The same is true of retries and failover: rare events are exactly what tail percentiles measure.
For workloads like these, the hard requirement is often a p99 below 600ms end to end. The tighter 300 to 400ms p95 target keeps the normal production path comfortably away from that ceiling. We evaluate those percentiles by source geography, destination region, route, replica state and failure mode. A single global percentile can otherwise hide a slow geography behind a large volume of nearby traffic.
Low-latency inference is a systems problem, not a model problem
"As fast as possible" is not an engineering specification. We started with a hard 600ms p99 envelope and assigned every stage a budget:
| Stage | p99 budget | What it includes |
|---|---|---|
| Model-serving path | 250ms | queueing, scheduling, prefill, decode and response serialization |
| Network and gateway path | 300ms | client round trip, edge routing, authorization/quota/billing, and gateway-to-GPU transport |
| Safety margin | 50ms | runtime variance and measurement uncertainty |
| Total | 600ms | end-to-end request |
The 300ms network-and-gateway allowance contains two logical hops. Hop one takes the request from the client through the AI gateway, where the API key, quota and billing policy are evaluated. Hop two takes the authorized request from the gateway to the selected inference server. The return path is included; counting only one-way transit would make the budget look better without making the user experience faster.
This split also made ownership clear. Model tuning could not compensate for an unpredictable ingress path, and a perfect route could not compensate for queueing on an oversubscribed GPU. Each side needed its own instrumentation and acceptance test.
Why data center benchmarks don't hold up under global production traffic
In a fixed data center, the variables can be removed one by one: one warm instance, one known model, a client on the same network, no autoscaling event, and no failing GPU. That benchmark is useful for isolating model execution, but it is not evidence that a production API will meet the same target.
Production adds the features customers actually need. The gateway must authenticate and meter every request. Traffic must balance across multiple instances and regions. When a GPU fails, requests must move immediately while replacement capacity starts and warms. When demand changes, the fleet must scale across locations where GPU capacity is available. All of that has to happen without turning a rare infrastructure event into a p99 violation.
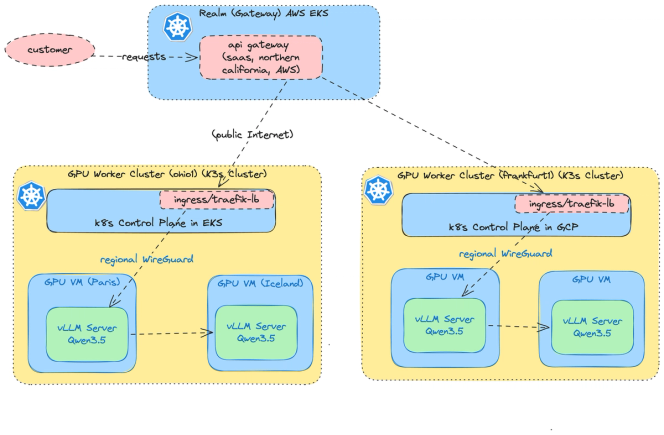
Our first important observation came from separating timestamps at the client, gateway and inference sidecar. The model-serving measurements were bounded; the long tail appeared before the request reached the GPU. We then segmented traces by source region, gateway region, selected GPU region, connection reuse, ingress path and replica health. The slow requests shared a pattern: they crossed a centralized gateway, returned to the public Internet, entered a regional Kubernetes load balancer and ingress stack, and only then traversed the private link to a GPU.
The typical case could still look good. The long path appeared intermittently, which is why it distorted p95 and p99 far more than p50. That finding changed the optimization order. Before spending the next millisecond on kernels or quantization, we had to remove variance from the route to the GPU.
Getting to the right region: Cloudflare at the edge
In the original path, every request landed at our fixed AI gateway in Northern California, regardless of where the client or selected GPU was located. The gateway performed the right production work, API-key validation, quota, billing and load-balancing decisions, but its position forced every request through the same location. From there, a request destined for Ohio or Frankfurt crossed the public Internet again, entered that cluster's load balancer and ingress, and only then moved toward a GPU.
The issue was not that Kubernetes ingress is inherently slow. It was that a global hybrid deployment combined several independently variable layers: wide-area routing, cloud load balancing, ingress proxying, service routing and the overlay path to hardware that might live in another provider. Each layer was reasonable in isolation. Their worst cases composed into an unacceptable tail.
We considered moving the whole serving stack or abandoning Kubernetes, but neither addressed the actual evidence. Kubernetes remained valuable as the control plane for scheduling, deployment and lifecycle management. What needed to change was the data path.
The pilot introduces a Cloudflare Worker as the customer-facing entry point. The Worker receives the request on Cloudflare's global network, applies lightweight routing policy, and selects a healthy regional gateway. A Cloudflare Tunnel connects that regional gateway to Cloudflare through long-lived, outbound connections, so the gateway does not need a public inbound address. Authorization, quota and billing still run in the trusted gateway; they are not pushed into an unaudited shortcut at the edge.
That distinction matters. The Worker is the early routing layer, not the system of record. The regional Java/WebFlux gateway remains responsible for identity and commercial policy, and it chooses a healthy inference replica from the current fleet state.
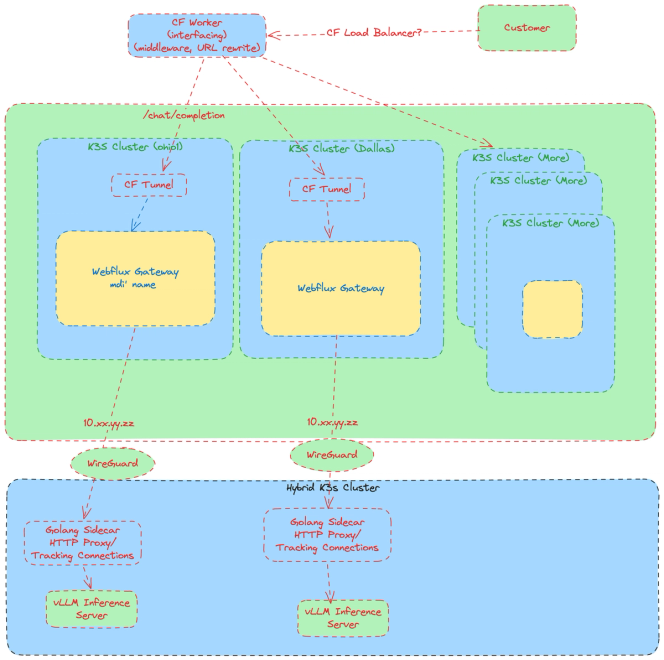
This removes the centralized public-Internet detour and the regional public ingress path from the critical route. It does not repeal physics, and it does not guarantee that the geographically nearest region is always the fastest or healthiest. Region selection therefore uses health and measured route quality, with geography as an input rather than the only rule.
The architecture is still a pilot, not a blanket production guarantee. The goal of the matched test is to prove that it narrows the tail across geographies before it becomes the default.
The final hop: bypassing Kubernetes with WireGuard P2P
Reaching the correct gateway solves only the first hop. The gateway still has to reach a specific healthy GPU, and the hybrid fleet spans cloud VPCs, data centers and GPU providers. Sending that traffic back through the general Kubernetes ingress and service path reintroduced the variability we had just removed.
We separated control plane from data plane. K3s and Rancher still deploy services, track desired state and manage the global fleet. The latency-sensitive request, however, takes a direct private path from the authorized gateway to the selected worker over the WireGuard-based mesh. The gateway's load balancer chooses the replica; WireGuard supplies the encrypted point-to-point transport. WireGuard itself is not a latency-aware global load balancer, so route quality and health remain application-level decisions.
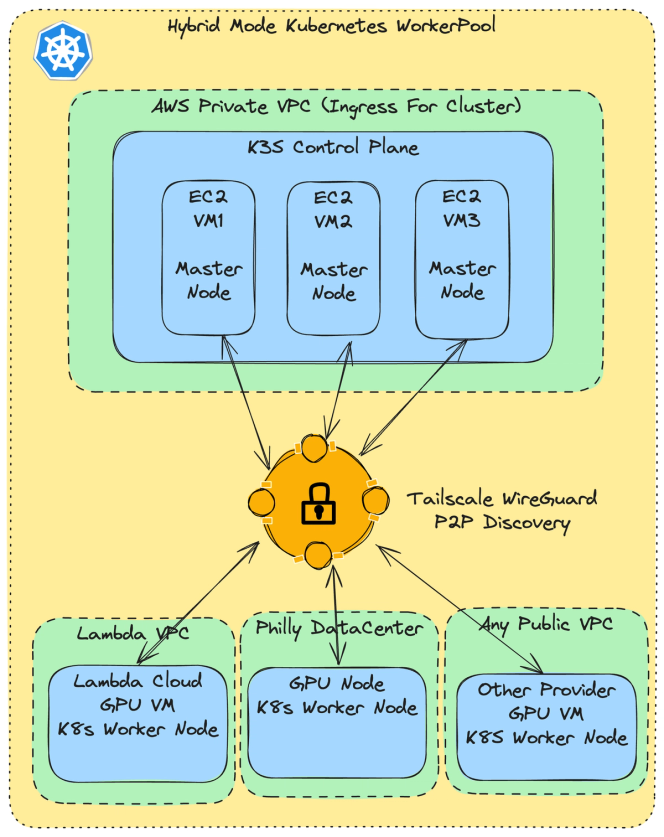
Every GPU worker joins the private mesh and advertises a stable endpoint. A lightweight Go sidecar in front of each vLLM server terminates the gateway connection, proxies the inference request and reports connection and health signals. Once a request clears billing and authorization, the gateway sends it directly to that sidecar instead of re-entering a generalized ingress path.
The resulting critical path has two deliberate jumps:
- Client → Cloudflare Worker → regional AI gateway: enter Cloudflare's network once, route early, and preserve centralized policy enforcement.
- Regional AI gateway → Go sidecar → vLLM: select a healthy replica and use the direct WireGuard path to the GPU.
The improvement comes from removing avoidable intermediaries and variance, not from claiming that an overlay can make distance disappear. The design also preserves provider flexibility: new GPU capacity can join the same private address space without forcing the request through a single cloud's networking stack.
Failover and load-balancing: Reliability can't be bolted on later
A deployment supporting a workload like this runs on multiple replicas. The gateway continuously removes unhealthy endpoints from selection, shifts traffic to available capacity, and triggers the fleet manager to replace failed capacity. That is the availability story, but it is not yet the complete latency story.
A failure can create three separate tail events: detection takes time, surviving replicas absorb a sudden queue, and replacement instances must load the model and warm up before serving traffic predictably. Autoscaling has the same cold-start problem even without a failure. For that reason, "we have redundant replicas" is not an adequate acceptance criterion on its own.
We test failure as a latency scenario. During a controlled GPU termination, we measure time to stop routing to the failed node, error and retry rate, p95/p99 during redistribution, queue depth on survivors, time to ready for the replacement, and time to warm performance. Capacity planning keeps enough headroom that the remaining replicas can absorb a failure without immediately saturating.
Failover cost is still being quantified across these deployments, so we do not present an unmeasured zero-impact claim. The production bar is explicit: a node failure should be a bounded latency event, not an outage and not an invisible exception to the 600ms target.
Tuning model serving for aggressive latency targets
The serving side owns 250ms of the p99 budget. We optimized for end-to-end latency rather than maximum throughput, reproducing the workload's token distribution and concurrency and measuring queueing and model execution separately. A configuration was useful only if it helped keep end-to-end p99 below 600ms without increasing errors or making burst behavior less predictable.
We ran experiments on a dedicated DataCrunch development instance, which made it faster to change one variable, warm the server and replay the same request profile. AI agents helped us explore vLLM's configuration space and surfaced options such as --kv-sharing-fast-prefill and --max-num-batched-tokens that we might not otherwise have tested. They generated useful hypotheses, but every configuration still required benchmarking against the actual workload.
We initially chose two B200 GPUs for the lowest possible latency. After tuning vLLM's scheduling, batching and token limits, we found that the workload was not making effective use of their compute and memory. A single H200 delivered nearly the same latency and now achieves the sub-600ms end-to-end p99 goal in production. We also validated that an H100 serving Gemma-4-26B could meet the target, although with slightly higher latency, and chose not to use that configuration in production.
As GPU execution became faster, other parts of the system became more visible in the tail. Nodes with the same GPU but different host CPUs—Intel Xeon 6767P and Xeon 6972P—showed meaningfully different latency. For low-latency inference, the CPU and network path therefore have to be benchmarked alongside the GPU.
The best configuration also changes with the workload. A request profile that once required tensor parallelism of two may later meet the same target with tensor parallelism of one as prompts, output lengths and concurrency shift. The lasting optimization was not a single flag or GPU choice, but a repeatable process for revalidating the full serving configuration against a concrete latency target.
Proving the path change
The final step is measurement. Mirroring live production traffic would create approval and isolation concerns, and naive synchronous mirroring could perturb the workload being measured. Instead, we clone a deployment and replay a sanitized, matched synthetic workload through the old and new paths side by side.
The comparison holds constant the model, GPU type, input/output token distributions, request rate, concurrency, connection-reuse policy and test duration. Traffic originates from the same set of geographies in both runs. Each request records client-to-edge, gateway processing, gateway-to-sidecar, queue, model and end-to-end timings. Results are reported as distributions by geography, not just one aggregate.
The benchmark also includes three non-steady-state phases: a burst, a GPU termination, and a scale-out event. The new path succeeds only if it improves p95/p99 without increasing errors, weakening quota and billing enforcement, or making failover less predictable.
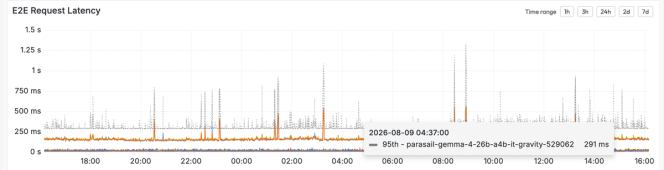
What to check off when choosing an inference provider
If you're evaluating an inference provider for a latency-sensitive workload, you need to look beyond demos and model benchmarks. Here are the measurements that have the most impact on production deployment, based on what we learned rolling this out across the platform:
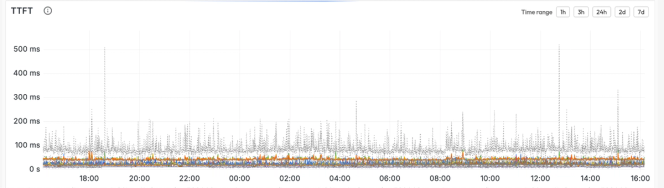
- p95 and p99 latency under real global routing conditions. Not a median measured from a single region.
- End-to-end latency, not model runtime by itself. A fast model behind a slow gateway is still slow.
- A stage-by-stage latency budget. Gateway, network, queue and model time should be separately observable.
- What actually happens to a request during failover, not just whether replicas exist.
- Replacement and warm-up time after a GPU failure. Traffic recovery and capacity recovery are different measurements.
- The gap between typical and worst-case latency. That gap tells you more than either number alone.
- Whether the provider tunes per deployment for your specific latency target, or runs everything against one generic configuration built for throughput.
- Your own token profile. Input and output size, concurrency, and request mix, because "dedicated GPU capacity" means something different for every workload.
Real-time AI products need latency to be treated as a product feature, not a model benchmark. The useful breakthrough was not one faster component. It was turning a 600ms goal into owned budgets, tracing the full request path, finding where rare network routes inflated the tail, and shortening that path while preserving the controls and failure handling that make the API production grade.
Technical notes and sources
- Cloudflare documents that Workers execute on its global network and can proxy requests to application origins: How Workers works and Workers routes.
- Cloudflare Tunnel uses origin-initiated, outbound-only connections; this supports private ingress without exposing a publicly routable origin IP: Cloudflare Tunnel.
- Kubernetes documents Services, ingress and service-proxy behavior as separate networking abstractions. The latency observations in this post are specific to our hybrid path, not a universal Kubernetes benchmark: Services, Load Balancing, and Networking.
- WireGuard provides the encrypted tunnel used for the private data path. Replica selection and latency-aware routing remain responsibilities of the surrounding system: WireGuard protocol and cryptography.


